Correlation Coefficient - Maple Help
For the best experience, we recommend viewing online help using Google Chrome or Microsoft Edge.

Online Help

Correlation Coefficient

Main Concept

Pearson Product-Moment Correlation Coefficient

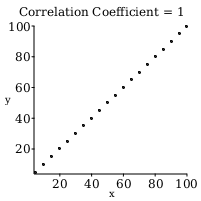
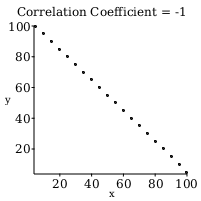
The Pearson Product-Moment Correlation Coefficient (also known as r) is a value that measures the correlation between two variables  and .

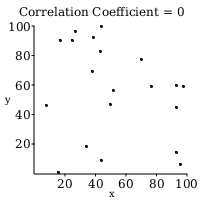
The coefficient value ranges from to , where a positive value represents a positive correlation, a value of  represents no correlation and a negative value represents a negative correlation.

Values of ± are considered total correlations and only occur when all of the data points lie on a straight line.

Data sets with values of r near 0 are considered to have weak correlations, while data sets with values of r near  or  are considered to have strong correlations.


Calculating r

The formula used to calculate the Pearson Product-Moment Correlation Coefficient (r) on a given sample is

where n represents the amount of data points and  are the samples indexed with .

Coefficient of Determination

The coefficient of determination measures how much of the variation in the value of y can be explained by the relationship between x and y.

This value, as a percent, can be calculated with  

Example: if  then the coefficient of determination of the data set is  0.52  which is  0.25.

This means that 25% of the variation in the value of y can be explained by the relationship between x and y. The other 75% remains unexplained.

Instructions

Click on the plot to make data point or press Randomly Generate Some Data Points to randomly plot a random amount of data points. At least three data points are needed to show the correlation coefficient.


Formula for correlation coefficient ( r )


More MathApps

MathApps/Statistics


Download Help Document